Declining profits and ever-increasing pressures on the cost-of-living can’t be fixed by magical Treasurers and economic voodoo. Don Sutherland argues, these are built into the system of capitalism itself.
The announcement of the Fair Work Commission’s (FWC) 2026 Annual Wage Review timetable late laste year underscores a pivotal battle for living standards, especially for workers on and below the median wage. This process, coinciding with the release of key economic data such as the national accounts and the government’s imminent Mid-Year Economic Outlook, provides information used by antagonists in debates and struggles over living standards and the environment.
For unions and workers, analysing this data from a working-class perspective is essential to, in the first instance, counter employer arguments for wage suppression.
Stagnant economy – dual pressure on workers and nature
The current broad economic picture shows modest, fragile growth, continually shaped in part by global weakness. This inevitably leads to employer pressure to suppress wages and other incomes, and to reduce the costs of taking from nature, and passing on to others the cost of replacing what has been taken.
To understand why resistance is crucial, we must examine quarterly fluctuations not as the mainstream does, but from a working-class viewpoint.
However, the longer-term trends in growth, profits, wages and expropriation, focusing on indicators like exploitation, investment and accumulation, tell us a lot more than mainstream commentary ignores or obscures. Most of the data is in the national accounts, both quarterly and annual. What follows uses mainly the annual national accounts.
Working hours and national accounts
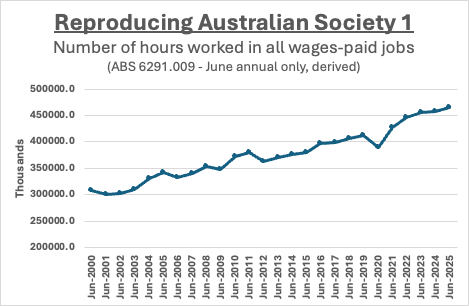
The story starts with working hours because paid working hours plus some forms of unpaid working time reproduce society every day, continuously. There are other important issues based on working hours that can be addressed in other posts.
The national accounts and growth
These working hours produce the value that is expressed by and for economists as the gross domestic product (GDP) in the national accounts.
Mainstream economists start with GDP: their crude measure of productivity, GDP per hour worked, flows from that.
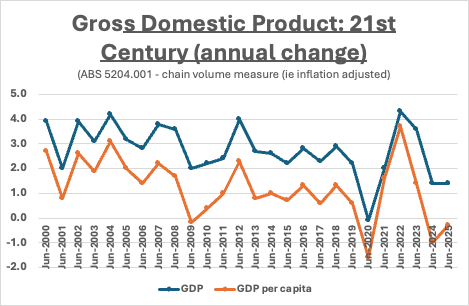
The next graph, using the annual data for the 21st century, reveals a troubling trend. First, we see a general downward trajectory in GDP growth, with weaker recoveries from downturns. Concurrently, GDP per capita – a rough indicator of average wealth – is declining. This stagnation occurs alongside unprecedented wealth accumulation by the top 5 to 10 percent of the population, highlighting a deepening divergence in economic fortunes with serious implications for living standards and union strategy.
Governments do not cause this problem; as will be seen, it is a product of how the economy works. However, mainstream governments can make the recovery or trough worse, or better, although who for and by how much will be in dispute.
That trend starts in 1960, with differences in detail.
Click here for the data back to 1960.
Unless there is a serious step forward on the right to strike, it’s doubtful the trend will reverse, even if there is a short-term recovery.
Profits and wages: the exploitation relationship
The core social relationship of capitalism is reflected in the division of the value workers produce into wages and profits. Workers are paid for only a portion of the value they create, the remainder taken by employers as profit. This is exploitation.
The next graph shows this social relationship of exploitation over the 21st century. We see the “rate of exploitation” has generally risen, despite one dip and maybe another. Currently, there may be a slight fall, but from what was a historical high. Employers will seek to reverse this.
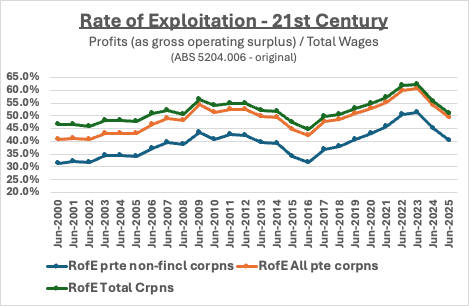
Mainstream economics treats profits and wages as separate market shares. In contrast, workers’ economics sees them as an interdependent social relationship showing the tension between workers and employers in speed-up, inadequate training, health and safety risks, and so on.
The longer-term trend shows a falling rate of exploitation from the late 1960s to mid-1970s, followed by a steady climb until recently in the post-COVID economy.
Investment decisions: what bosses do with profits
A critical question is what happens to these profits.
Other posts have discussed this question from different angles.
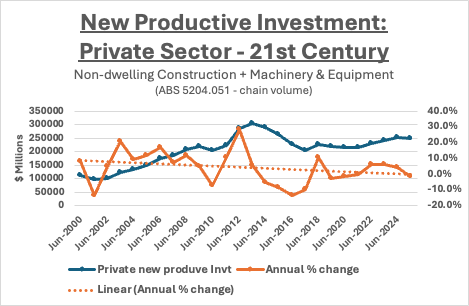
The most socially significant use, from a job creation and firm sustainability perspective, is productive investment – new machinery, equipment, and facilities. Generally, the ups and downs of this investment follow profits.
The recent quarterly accounts highlighted a rise in investment, partly driven by AI data centres. However, the longer-term annual trend tells a more accurate story.
The rate of productive investment over the 21st century has been slowing.
This matters for workers and their unions because it is a factor in fragile job security and vocational training, the real source of productivity problems, and influences bargaining power.
Again, going back to 1960, the trend oscillates downwards.
Even though the rate of new productive investment is slowing, new physical capacity is being added to the total capital stock.
Profitability, accumulation and an ailing system
For business owners, “profitability” is key: total profit measured against the total capital stock (factories, machinery) plus wages. As the value of the capital stock grows, maintaining the rate of profit requires wage suppression, lowering interest rates, or raising prices.
All employers aim for accumulation. Their personal wealth rises at the expense of workers and their families, and whether they survive the heat from their competitors.
The final graph shows the rate of accumulation in the 21st century slowing steadily, particularly after the 2008-09 global financial crisis. The post-crisis recovery was weak, quickly giving way to decline and now stagnation.
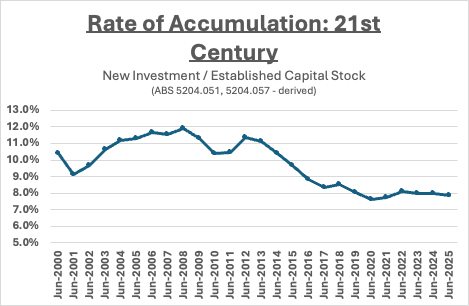
Thus, despite all advantages given to employers, they are collectively running an ailing system. Their proposed solutions – intensifying the exploitation of labour and the expropriation of nature – will create further crises, for example masses of water and electricity supply into the new data centres and or huge armaments outlay on AUKUS and other military spending. Employer demands for “productivity” are less about genuine efficiency and more about attempting to reverse the decline in their rate of accumulation – the tendency of the rate of profit to decline.
If you sense the country is “going to the dogs”, this and the other declines show “Yes, it’s the system.”
Conclusion: who pays?
Throughout labour movement history, moderate voices have argued for compromise when the economy recedes or the system weakens. The smart militants said NO and led important victories. The central question for today’s union and social movements is whether we accept proposals to moderate our demands and expectations.
If not, what are our alternative demands? How will we counter employer retaliation? What strategy can achieve these goals? Ultimately, must our demands point toward the possibility of a fundamentally different society, with a very different mob in charge? The economic data reveal a system failing the majority. The wage review is one frontline in the broader struggle over who pays for this failure and who benefits from our collective work.
Click here for the data back to 1960.
This article originally appeared on Solidarity Dynamics, Don Sutherland’s substack.